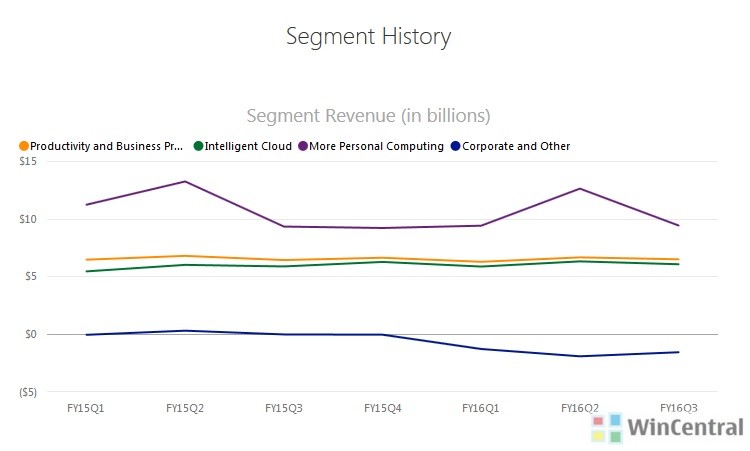
Microsoft has announced it FY16 Q3 or normally what is Q1 2016 results. The total revenue was $20.5 Billion with net income of $3.8 Billion. Cloud, Office, Search, Surface, Gaming all posted increase in revenues while Windows and Phones reported decline in revenue. Read on for overall and segment wise highlights from the Earnings report.
Microsoft Earnings Highlights
Overall:
- Revenue was $20.5 billion GAAP, and $22.1 billion non-GAAP
- Operating income was $5.3 billion GAAP, and $6.8 billion non-GAAP
- Net income was $3.8 billion GAAP, and $5.0 billion non-GAAP
- Earnings per share was $0.47 GAAP, and $0.62 non-GAAP
Windows, Devices, Search & Gaming:
- Search advertising revenue increased $538 million or 55%. Search advertising revenue, excluding traffic acquisition costs, increased 14%, primarily driven by growth in Bing, due to higher revenue per search and higher search volume.
- Gaming revenue increased $64 million or 4%, primarily due to higher revenue from Xbox Live and video games, offset in part by lower Xbox hardware revenue. Xbox Live revenue increased 22%, driven by higher revenue per transaction and volumes of transactions, as well as growth in subscribers. Video games revenue grew 9%, driven by the sales of Minecraft. Xbox hardware revenue decreased 26%, mainly due to a decline in Xbox 360 console volume and lower prices of Xbox One consoles sold.
- Windows revenue decreased $292 million or 7%, mainly due to lower revenue from patent licensing and Windows OEM. Patent licensing revenue decreased 26%, due to a decline in licensed units and license revenue per unit. Windows OEM revenue decreased 2%. Windows OEM Pro revenue declined 11%, driven by a decline in the business PC market. Windows OEM non-Pro revenue grew 15%, outperforming the consumer PC market, driven by reductions in OEM non-Pro channel inventory in the prior year and a higher mix of premium licenses sold in the current year.
- Devices revenue decreased $248 million or 11%, driven by the previously announced change in strategy for the phone business, offset in part by higher Surface revenue. Phone revenue decreased $662 million or 47%, as we sold 2.3 million Lumia phones and 15.7 million other phones in the third quarter of fiscal year 2016, compared with 8.6 million and 24.7 million sold, respectively, in the prior year. Surface revenue increased $398 million or 56%, primarily driven by the release of Surface Pro 4 and Surface Book in the second quarter of fiscal year 2016, offset in part by a decline in revenue from Surface Pro 3.
Cloud:
- Intelligent Cloud revenue increased $193 million or 3%, mainly due to higher Enterprise Services revenue, as well as higher server products and cloud services revenue. Intelligent Cloud revenue included an unfavorable foreign currency impact of approximately 5%.
- Enterprise Services revenue grew $137 million or 11%, mainly due to growth in Premier Support Services, offset in part by an unfavorable foreign currency impact of approximately 4%.
- Server products and cloud services revenue grew slightly, driven by revenue growth from Microsoft Azure of 110%, offset in part by a decline in revenue from our on-premise server products. Server products and cloud services revenue included an unfavorable foreign currency impact of approximately 5%.
Office & Dynamics:
- Productivity and Business Processes revenue increased $65 million or 1%, due to higher revenue from Office and Microsoft Dynamics. Productivity and Business Processes included an unfavorable foreign currency impact of approximately 5%.
- Office Consumer revenue increased $23 million or 3%, driven by revenue growth from Office 365 Consumer subscribers and higher revenue per license, offset in part by an unfavorable foreign currency impact of approximately 3% and a decline in the consumer PC market.
- Office Commercial revenue increased $20 million, driven by higher revenue from Office 365 Commercial, mainly due to growth in subscribers, offset in part by an unfavorable foreign currency impact of approximately 7% and lower transactional license volume, reflecting a continued shift to Office 365 Commercial and a decline in the business PC market.
- Microsoft Dynamics revenue increased 4%, mainly due to higher revenue from Dynamics CRM Online, driven by seat growth. Microsoft Dynamics revenue included an unfavorable foreign currency impact of approximately 5%.
